
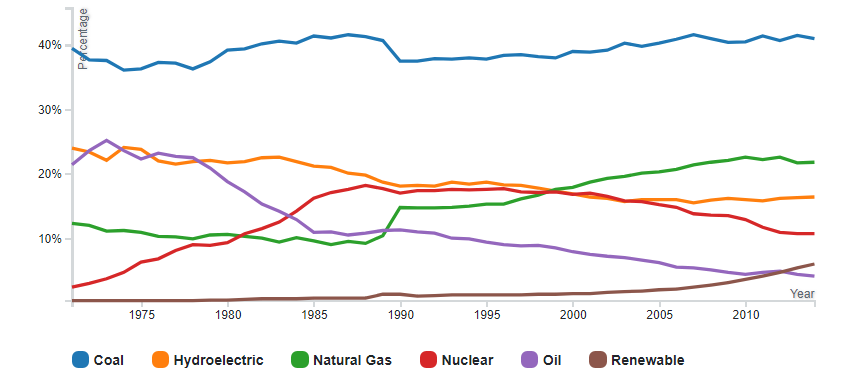
A multi-line graph illustrating the percentages of the world's total primary energy supply that is used to generate electric power.
The main outcome of this project is to show my ability in creating a multi-line graph that is responsive and shows tooltips on hover.
View Project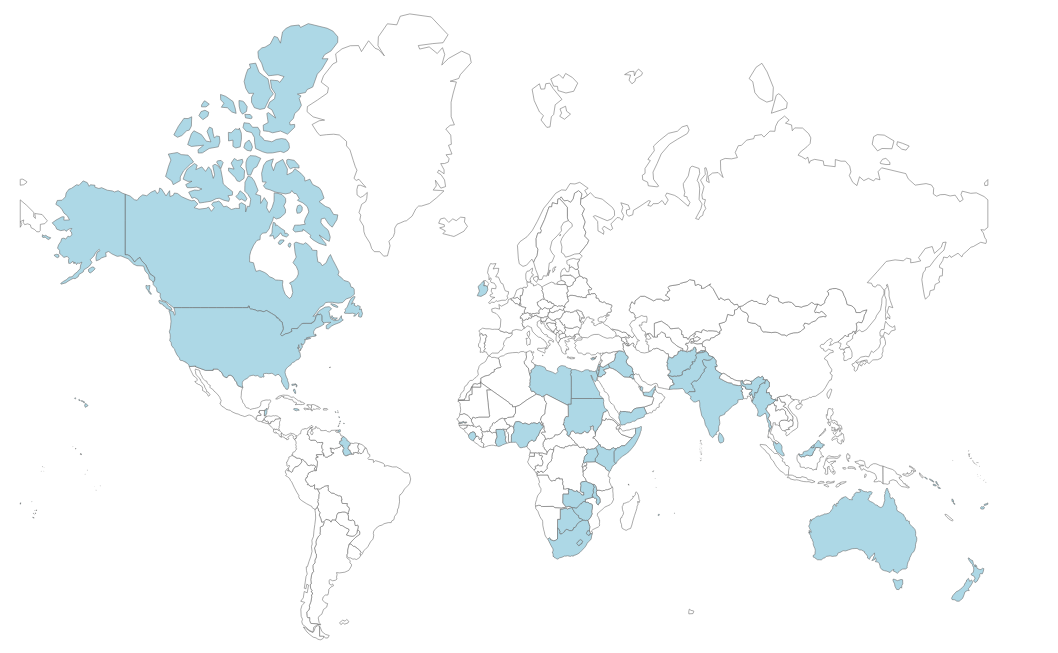
A storytelling D3 visualization using a mercator projection to draw the map, lighting up countries that gained their indepdendnce from the UK.
After the animated visualization ends, the map becomes interactive with each country country getting coloured and a tooltip appears showing the name of the country and the independence day if applicable.
View Project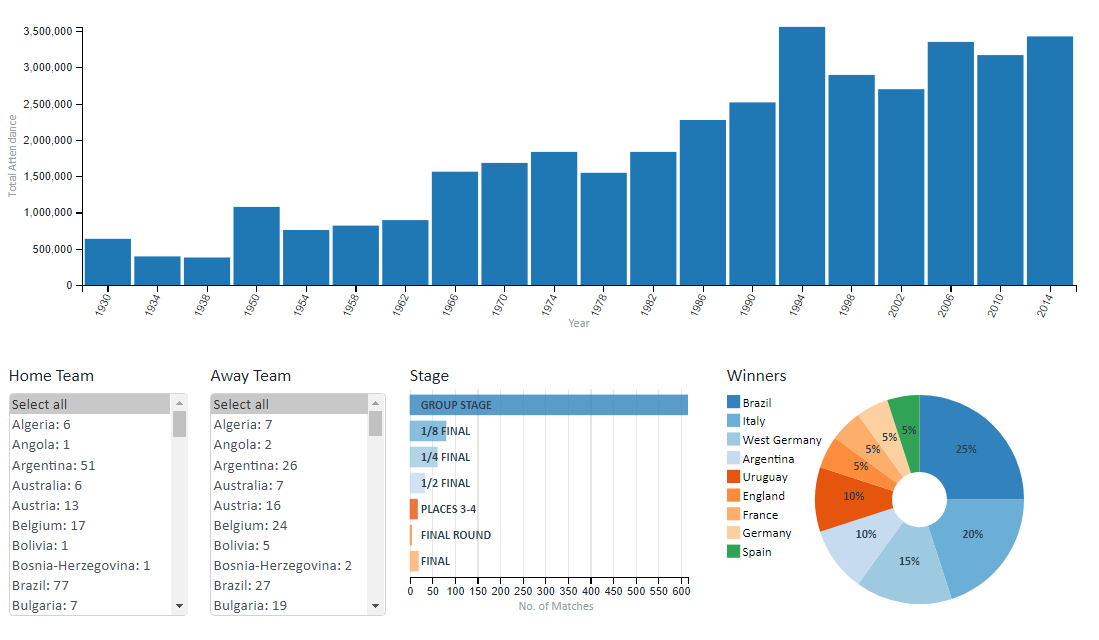
A FIFA World Cup dashboard focusing on exploring the number of attendees of the world cup over the years.
It is created using DC.js, which is a charting library with native crossfilter support.
DC.js library allows for the creation of multiple charts that can be natively supported by crossfilter which makes it easier to filter on one chart and allow for those filter to take effects on the rest of the dashboard.
View Project